Posts

Showing posts from August, 2023

SAC R-Visualization#3

Image
 SAP Analytics Cloud R-Visualization#3 Jitter Plot Chart  # Simulates data and visualizes then as a Jitter Plot # load packages library(ggplot2) # assign dataset.seed(123) myData <-diamonds[sample(nrow(diamonds),9000),] #add styling outputGraphics <- ggplot(myData, aes(x = color, y = price/carat, color = color))+geom_jitter()+ggtitle("Diamond Price by Color")+xlab("Diamond Colour")+ylab("Price per Carat") #output output(Graphics + theme_bw() +theme(legend.position = "none",aspect.ratio =1, panel.grid.major = element_blank(), panel.grid.minor = element_blank(), plot.title = element_text(hjust = 0.5), text = element_text(size = 15))
SAC R-Visualization#2

Image
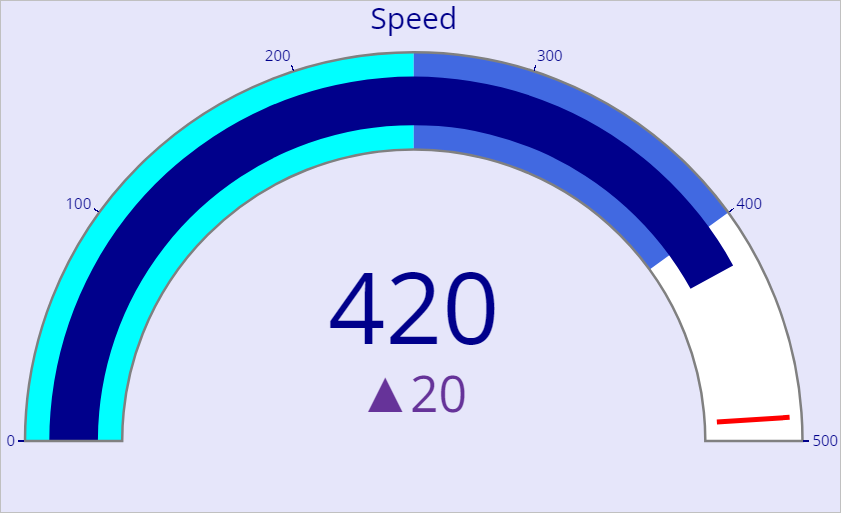
SAP Analytics Cloud R-Visualization Gauge Chart library(plotly) library(ggplot2) fig <- plot_ly( domain = list(x = c(0,100000), y = c(0,100000)), value =  select model$ 'variable', title = list(text="Give your Title"), type = "indicator", mode = "gauge+number+delta", delta= list(reference=80000), gauge= list( axis = list(range= list(NULL,100000), tickwidth=1, tickcolor="darkblue"), bar = list(color= "limegreen"), steps = list(                    list(range = c(0,40000), color="darkslategrey"),                    list(range =c(40000,80000), color= "cadetblue"),                    list(range =c(40000,95000), color= "darkturquoise")),                    threshold=list(                    line= list(color= "red" , width =4),                    thickness=0.75,                    value=95000))) fig <- fig%>% layout( margin =list(l=50,r=50), font = list(color="Black", family =&

SAC R-Visualization#1

Image
SAP Analytics Cloud R-Visualizations#1 #Guage library(googleVis) gvisGuage(BestRunJuice_SampleModel,options=list(min=0, max=800, greenFrom=0, greenTo=100,  yellowFrom=101, yellowTo=500, redFrom=501, redTo=800, width=400, height=300)) #Guage$html$footer<- NULL #Guage$html$jsfooter<- NULL #Guage$html$caption<- NULL plot(Guage)