Posts

SAC Import Connection Limit

Image
 SAP Analytics Cloud Limitations for Acquired Connection: https://help.sap.com/docs/SAP_ANALYTICS_CLOUD/00f68c2e08b941f081002fd3691d86a7/5f61b6509a5e4d499e8cb9685f32db73.html

Create Import Connection in SAC tenant on File Server for Excel files

Image
Create a Connection in SAC tenant on File Server for Excel files import to build and schedule data load periodically into SAC Acquired Models. Go to SAC System Administration --> System Integration Enable option "Allow model import from File Server"  Enable second option in screenshot if users required to export files.

Direct Filters vs Indirect Filters in SAC Stories

Image
 Direct Filters vs Indirect Filters at Page level in SAC Stories: When you create filter(s) on top of Secondary Model dimensions in where linked models ( Blended / joined ) with Primary model in SAC stories will not support due to limitation ( Live Connection Scenario ). Resolution: Create Dimensions based Primary model or Have limited master data below described in this warning.  

SAC R-Visualization#3

Image
 SAP Analytics Cloud R-Visualization#3 Jitter Plot Chart  # Simulates data and visualizes then as a Jitter Plot # load packages library(ggplot2) # assign dataset.seed(123) myData <-diamonds[sample(nrow(diamonds),9000),] #add styling outputGraphics <- ggplot(myData, aes(x = color, y = price/carat, color = color))+geom_jitter()+ggtitle("Diamond Price by Color")+xlab("Diamond Colour")+ylab("Price per Carat") #output output(Graphics + theme_bw() +theme(legend.position = "none",aspect.ratio =1, panel.grid.major = element_blank(), panel.grid.minor = element_blank(), plot.title = element_text(hjust = 0.5), text = element_text(size = 15))

SAC R-Visualization#2

Image
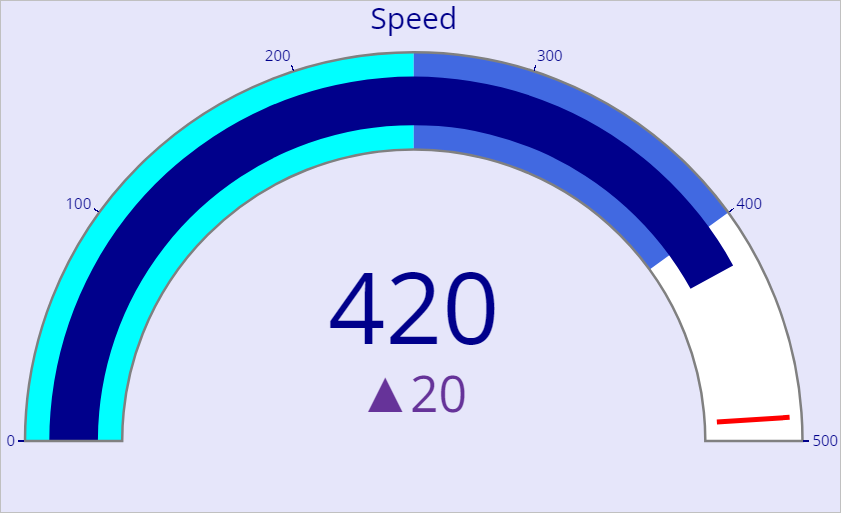
SAP Analytics Cloud R-Visualization Gauge Chart library(plotly) library(ggplot2) fig <- plot_ly( domain = list(x = c(0,100000), y = c(0,100000)), value =  select model$ 'variable', title = list(text="Give your Title"), type = "indicator", mode = "gauge+number+delta", delta= list(reference=80000), gauge= list( axis = list(range= list(NULL,100000), tickwidth=1, tickcolor="darkblue"), bar = list(color= "limegreen"), steps = list(                    list(range = c(0,40000), color="darkslategrey"),                    list(range =c(40000,80000), color= "cadetblue"),                    list(range =c(40000,95000), color= "darkturquoise")),                    threshold=list(                    line= list(color= "red" , width =4),                    thickness=0.75,                    value=95000))) fig <- fig%>% layout( margin =list(l=50,r=50), font = list(color="Black", family =&

SAC R-Visualization#1

Image
SAP Analytics Cloud R-Visualizations#1 #Guage library(googleVis) gvisGuage(BestRunJuice_SampleModel,options=list(min=0, max=800, greenFrom=0, greenTo=100,  yellowFrom=101, yellowTo=500, redFrom=501, redTo=800, width=400, height=300)) #Guage$html$footer<- NULL #Guage$html$jsfooter<- NULL #Guage$html$caption<- NULL plot(Guage)

Performance Tuning in SAP BI/BO

SAP BO Performance Tuning @ Various levels: Connection Level: Use 64 bit connection types @64 bit Operating System rather 32 bit connection type. Database Level/OLAP cubes/BEx Queries: Healthy DWH or well design of Database, its tables with Indexes built. Semantic/Universe Level: Formulas, Aggregate functions, Aggregate_Awareness, LOVs, Group by, Prompts based on Year, Quarter, Month, Weeks, Day at Database level, Aggregated/Pre-calculated Tables. Array fetch size:  Increase Array fetch size at Universe Designer Level. Suppose if we have a report with 5000 Rows, if the Array Fetch size is 100 then BO server connect with the back-end database 50 times. Each Time BO server fetches 100 records. Client Tools/Report Level: Web Report: Crystal Report: Dashboards: As part of Maintenance activities, clear caches,GC With scheduled restart on production on Non-Business Hours. Server Level: Split APS for Webi, Crystal, Dashboard services. Configure DSL Bridge.  Clone m

SAP Text Analysis

1. Linganalysis Configurations: I. Basic II.Stems III.Full 2. Extraction Configurations: I. Core II.Core VoiceOfCustomer

SAP HANA Hardware Certification Appliance

SAP HANA-HWC-AP Intel Processors: Nehalem, Westmere, Ivy. PAM: http://service.sap.com/~sapidb/011000358700000701932011E  SAPS:SAP Application Benchmark Performance Standard (throughput unit for HW sizing)