Posts

Error while executing SAP BI Web Report, Error Message: Result set too large (4052816 cells); data retrieval restricted by configuration (maximum = 50

The maximum amount of cells is limited to 500000 cells by default. Please execute your query from Query Designer. After the query is executed in web (Web Analyzer) change the following parameters: 1. Settings 2. Data Provider 3. Size Restriction for Result Sets / Maximum No. of Cells for Result Set: 4. Change Drop-down Box to "Custom-Defined No. of Cells" 5. As far as I know you can set a max. of 2500000 cells. (Or) You can change the allowed size of cells by doing the following: T.code SE38, enter SAP_RSADMIN_MAINTAIN and give object= BICS_DA_RESULT_SET_LIMIT_MAX. Change the value to the number of rows you wish to display, say 1500000 in your case. Please be aware that the more cells you display the worse the performance of your query will be.
SAP Business Objects Universe Designer Preventing Chasm and Fan Traps - Context & Alias

Image
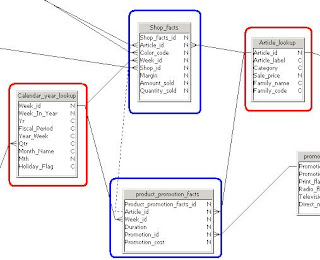
In this article I would like to talk about Chasm traps and Fan traps . These are problems that we often experience while building universes and reports. When encountering these traps, one may wonder what is going on? How come my sum statements aren't adding up correctly? Or why am I missing some rows? A properly designed universe will help avoid these problems. In addition, a good understanding about measures and contexts from report designers will help as well. Chasm Traps Let’s talk about Chasm traps first. In short, a Chasm trap can be imagined as a bottomless pit where some rows may unknowingly fall in and never come back out. So when viewing a report caught in a Chasm trap, one may ask “Hey where did Record X go??”. Many to one joins from two fact tables converge on a single look-up table. This type of join convergence is called a Chasm trap . Looking at the eFashion Universe (note that this is a modified version of the efashion ...

Difference b/w SAP BusinessObjects Web Intelligence (WEBI) Reports, Crystal Reports and Crystal xcelsius ?

'ALL' IN @Prompt('Enter a value or All', 'A', 'Class/Object', Multi,) table.column in @prompt('Enter value or All', 'A', 'Class\Object',Multi,) The Datasource for Xcelsius is not limited to excel, it can fetch data through some data connectivity components like Web service, Live Office connection, SAP connection, many more…… The main difference between teh BusinessObjects Web Intelligence(WEBI), Crystal Reports and Xcelsius is BusinessObjects Web Intelligence(WEBI) and CR are reporting tools and Xcelsius is a Dynamic Dashboard tool where we can provide a What-If scenario to the end-user. The output of the reports in BusinessObjects Web Intelligence(WEBI) and Crystal Reports are limited to pdf, word etc.. but Xcelsius gives output as all the above mentioned formats and a unique format .swf (a flash file). In BusinessObjects Web Intelligence(WEBI) and Crystal Reports we can find the page refresh rate where as i...

Acronyms come across SAP & Non-SAP

SAP BO Universe Types: .unv, .unx CNX:files for connections DFX:Data Foundation BLX:Business Layer A UNX is the result of CNX + DFX + BLX. SAP BO Crystal Reports: The Java version of Crystal Reports supports .unv, .unx extension universes. The C++ version of Crystal Reports only supports .unv universes New Naming Conventions in SAP BO XI 3.1 VS 4.0: SAP BO XI 3.1 SAP BO XI 4.0 Universe Designer Tool Universe Design Tool Information Design Tool Web Intelligence Web Intelligence Voyager Advanced Analysis Tool InfoView BILaunchPad

SAP R/3 or ECC DataSources for SAP BI 7.0

Financial Accounting: General Ledger:FI-GL (BKPF, BSEG Tables) 0FI_GL_1:General ledger: Transaction figures 0FI_GL_2:General ledger: Transaction figures - Cost of sales ledger 0FI_GL_4:General Ledger: Line Items with Delta Extraction 0FI_GL_6:General Ledger Sales Figures via Delta Extraction 0FI_GL_7:General Ledger Cost of Sales Ledger via Delta Extraction 0FI_GL_8:General Ledger: Statistical Key Figures 0FI_GL_10:General Ledger: Leading Ledger Balances 0FI_GL_14:General Ledger: Line Items of the Leading Ledger(New GL in ECC) 0FI_TX_4: Taxes:General Ledger:Data for Tax on Sales/Purchases 0ACAC_CALC:Manual Accruals: Calculated Accrual Values 0ACE_CALC_RESULT:Accrual Engine: Calculated Accrual Values Financial Accounting: Customers:FI-AR ( BSIK, BSAK Tables) 0FI_AR_1:Customers: Transaction figures 0FI_AR_2:Customers: Item 0FI_AR_3:Customers: Line Items 0FI_AR_4:Customers: Line Items with Delta Extraction 0FI_AR_5:Customers: Payment History 0FI_AR_6:Customer Sales Fi...

SAP R/3 or SAP ECC Reporting Limitations

1. SAP R/3(OLTP) offers a collection of more than 2700 powerful and flexible business reports. These reports are spread across several applications. Navigating through several multilevel menus to fetch a particular set of reports is a time consuming process.   2. Several reports are designed(delivered by default) to meet operational or transaction needs only.   3. Most of the reports are predefined, list oriented & provides very limited OLAP functionality.   4. Several business applications and their associated reporting tools make it hard to select a specific reporting tool.   5. These reporting tools are inconsistent, designing & creating a report is a complex process.   6. Maintenance of thousands of available reports for software upgrade (VERSION UPGRADE) is a complex task.   7. Knowledge of how often a particular report is used are every period is not available.   8. As a consequence( Consequently) all...

MDX

Image
Definition MDX (multi-dimensional expressions) is a language developed by Microsoft for queries using multi-dimensional data. An MDX expression returns a multi-dimensional result set ( dataset) that consists of axis data and cell data. The syntax of multi-dimensional expressions is defined in the Microsoft specification OLE DB for OLAP. Structure The following table gives an overview of the most important components of MDX statements: MDX Component Significance FROM Cube selection SELECT ON COLUMNS ON ROWS Axes definition Definition of column axes Definition of rows axes WHERE Filter conditions definition Example 1: The following example of a MDX request contains the above elements: SELECT { [Measures].[CKF_SI_PROFIT], [Measures].[0D_DOCUMENT], [Measures].[0D_OORVALSC] } ON COLUMNS, NON EMPTY [0D_PLANT].MEMBERS ON ROWS FROM [0D_SD_C03/SAP_DEMO_OLEDB] WHERE ( [0CALMONTH].[200101], [0D_COUNTRY].[US] ) The following graphic shows this exa...

Difference Between Crystal Reports and Web Intelligence Reports / BEx Analyzer Vs Excel OLAP Vs BO Analysis Edition for MS Office.

Image
Crystal Reports is under SAP’s Crystal Solutions product portfolio while Web Intelligence is under SAP’s Business Objects Web Intelligence line. Crystal Reports is best for highly structured reports while Web Intelligence is suited for ‘unstructured’ reports. Crystal Reports has an advantage when the presentation and formatting of the report is of the highest concern. Crystal allows for pixel perfect, high fidelity reports, and allows the report developer more control of the presentation and data access. Crystal reports take a bit longer to develop, and require a higher understanding of database design and logic. WebI reports is the better solution when the report needs to be developed quickly and will be developed by a Business User. Crystal Reports is the better solution when the report presentation is of the highest concern, and the report can be developed by an IT Developer of Business Power User. Crystal Reports can’t have more than one report in it. Like in BO reports we...